.svg)
.svg)
The Value of Managed Charging: An Illustrative Example from PJM
WeaveGrid’s DISCO platform provides asset-level visibility and device-level control, optimizing EVs, batteries, and other flexible loads exactly where constraints hit, from transformers up to the bulk system. Our multi-DER platform began with a focus on cost-effective EV managed charging, which we will explore further in this article.
Managed charging aims to make electricity more affordable for everyone - whether you drive an EV or not. But how can we estimate the benefits of managed charging and their effect on electricity prices?
To answer this question let’s look at a hypothetical utility in PJM (the electricity market that serves 13 states and DC). We will estimate the benefits per vehicle compared to both unmanaged charging (i.e. charging without being influenced by a program) and charging according to TOU rates (hereafter referred to as “passive managed charging”).
This simple analysis will only look at the major categories of utility system costs, as shown below. Many regulators may recognize other benefits, such as carbon emission reductions, but for the purpose of simplicity and brevity, those benefits are outside the scope of this analysis.

Generation Capacity
Generation and transmission benefits are created by reducing electricity demand when the system is strained. This occurs when electricity demand is the highest and electricity supply is low - for example when intermittent resources such as wind and solar are not producing energy or when there may be outages for coal or gas-fired power plants.
Currently, WeaveGrid’s managed charging programs are primarily designed to reduce electric demand during summer months, so we’ll examine the key hours when PJM is expected to need generation. According to a recent report by the North American Electric Reliability Corporation (NERC), these key times are hours ending 19 and 20 (6-8 pm).
The chart below shows actual EV load shapes in a managed charging program compared with a “Charge Now (flat rate)” Counterfactual where each of the EVs commences charging immediately after being plugged in. The Charge Now (flat rate) load shape reflects unmanaged charging. The key times of hours ended 19 and 20 (6-8 pm) are highlighted in yellow.
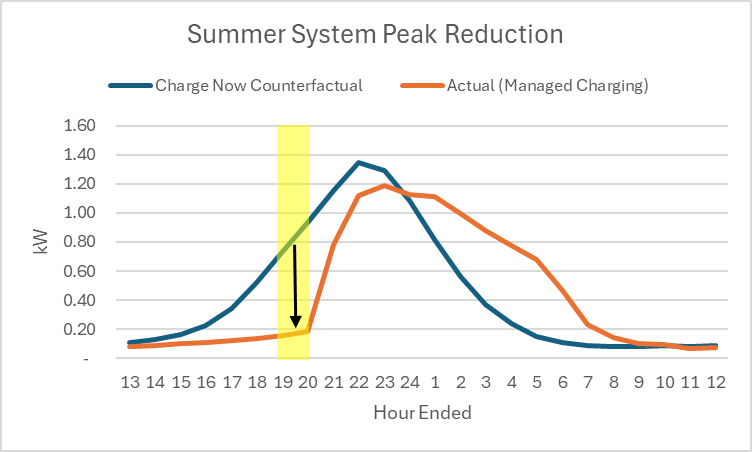
The Charge Now (flat rate) has a contribution to the system peak of 0.84 kW per EV compared to the actual load shape under Active Managed Charging with 0.17 kW, resulting in a system peak demand reduction of 0.67 kW compared to unmanaged charging.
The 0.67 kW system peak reduction occurs at the customer’s meter. Accounting for an assumed 7% line loss rate results in 0.72 kW demand reduction at the generator - the level that matters for PJM's purposes.
PJM’s 2027/2028 capacity auction would have cleared at a price of $530/MW-day without a cap being placed on the maximum price, which converts to $193/kW-year. This uncapped price is the best estimate for the full economic value of generation capacity given that the cap is artificially placed to reduce prices for retail customers and thus is not a complete reflection of supply and demand.
Applying the $193/kW-year to a 0.72/EV peak demand reduction results in a generation capacity value of roughly $140 per year compared to unmanaged charging.
Most of these benefits can be achieved through the use of TOU rates or a passive managed charging program (hereafter referred to as “passive/TOU-based” charging). However, WeaveGrid’s data suggests that active managed charging is slightly more effective in reducing system peak, achieving an incremental demand reduction of roughly 0.10 kW/EV compared with passive/TOU-based charging. Grossing up for line losses results in 0.1075 kW/EV. Therefore, the incremental annual value of active over passive/TOU-based charging is roughly $20/EV.
Transmission Capacity
A report commissioned by the Pennsylvania Public Utility Commission offers estimates for the value of avoided transmission capacity. The chart below shows the value per kW for each PA utility in 2026 dollars.

Using the median value of $76/kW-year and applying the system peak reduction of 0.72 kW results in an annual value of roughly $55 per EV compared to unmanaged charging.
Applying the estimated incremental system peak reduction of 0.10 kW from going from passive/TOU-based charging to active managed charging implies an annual value of roughly $10 per EV.
Distribution Capacity
An Argonne National Lab (ANL) study on WeaveGrid’s distribution-optimized managed charging programs (like DISCO) in Maryland estimated a $297/EV annual distribution value. WeaveGrid considers the ANL study to be the industry-leading analysis due to its granular analysis of secondary transformers across multiple feeders.
SEPA notes that ANL’s “estimated benefits may be conservative due to inflation in distribution costs outpacing the assumed 3% inflation rate by ANL. For example, the cost of a 150 kVA transformer has increased at a rate of 4.96% in recent years”.
There have been several other studies that have backed up ANL’s finding that distribution-optimized managed charging creates substantial distribution value. For example, a recent Brattle study estimated the annual distribution benefit of distribution-optimized managed charging at $180/EV. An AES Indiana study found that each EV enrolled in grid-optimized managed charging created $1,275 in annual capital flexibility.
For the purposes of analyzing the benefits of DISCO-based active managed charging compared to unmanaged charging, we will use the average of the Argonne and Brattle studies, rounded to the nearest $10 - resulting in an annual value of $240/EV.
The Argonne National Lab study does not provide an incremental value for active compared to passive/TOU-based managed charging. However, the Brattle report estimates the incremental annual value at roughly $200/EV. The high incremental value is because passive or TOU-based charging tends to create “timer” or “secondary” peaks that occur when many EVs are scheduled to begin charging simultaneously.
Generation Energy
The Brattle study estimates $20-$40/EV in annual generation energy benefits created by shifting load to times when they can be served by more efficient power plants. This aligns with WeaveGrid’s experience, where programs typically achieve $30-$50 in annual generation energy savings. For the purposes of this analysis, let us assume an annual value of $40/EV. For simplicity’s sake, we will not assume any incremental value related to generation energy from going from passive/TOU-based charging to active managed charging.
The Total Value of Managed Charging
In total, the annual benefits of managed charging estimated in this analysis add up to $475 per EV compared to if there is no managed charging program (i.e. unmanaged charging).
The Table below shows the per vehicle annual value of distribution-optimized managed charging compared to both unmanaged charging and passive/TOU-based charging.

Let’s say a program costs no more than $350 per EV each year, accounting for both administrative costs and any incentives. This means that managed charging should be cost effective as well as put downward pressure on rates by over $125/EV each year.
Similarly, the incremental costs from going from passive to active managed charging should be less than $100 per EV each year, compared to $230 in benefits. Thus, it is worthwhile to invest in distribution-optimized managed charging.
This analysis excludes other benefits, such as carbon emission reductions, reducing market prices for energy and capacity (i.e., the “market price effect”), enhanced reliability, or economic development benefits. Therefore, the total economic or social value of managed charging for a utility in PJM may be even greater!
This blog post was contributed by WeaveGrid's Brad Harris.
.png)


.png)


.png)


.png)
.png)


.jpg)


